Explore mesh topology in Kiali
This chapter presents how to analyze service mesh topology and configuration using the Kiali Istio addon.
Outline
In this chapter you will learn:
- How to access the Kiali dashboard.
- How to analyze service mesh topology and traffic.
- How to examine service mesh configuration.
Walkthrough
Kiali is a management console for Istio service mesh with strong observability, configuration and validation capabilities. It provides a dashboard visualizing the mesh topology with rich information about inter-service dependencies and traffic health (latency, errors). Moreover, Kiali enables inspecting and producing service mesh configuration via a web interface and observing how the updated configuration affects performance of individual application services.
Kiali helps to answer the following questions:
- Which microservices are part of my service mesh?
- How are they connected?
- How are they performing?
- How can I operate on them?
Access the dashboard
Port-forward the Kiali dashboard to your local machine:
$ istioctl dashboard kiali
Your browser should startup automatically and display the dashboard. Otherwise, visit the address: http://localhost:20001.
Login using the default credentials: admin/admin.
Analyze the service graph
After logging in, the dashboard should present the Overview page, similar to:
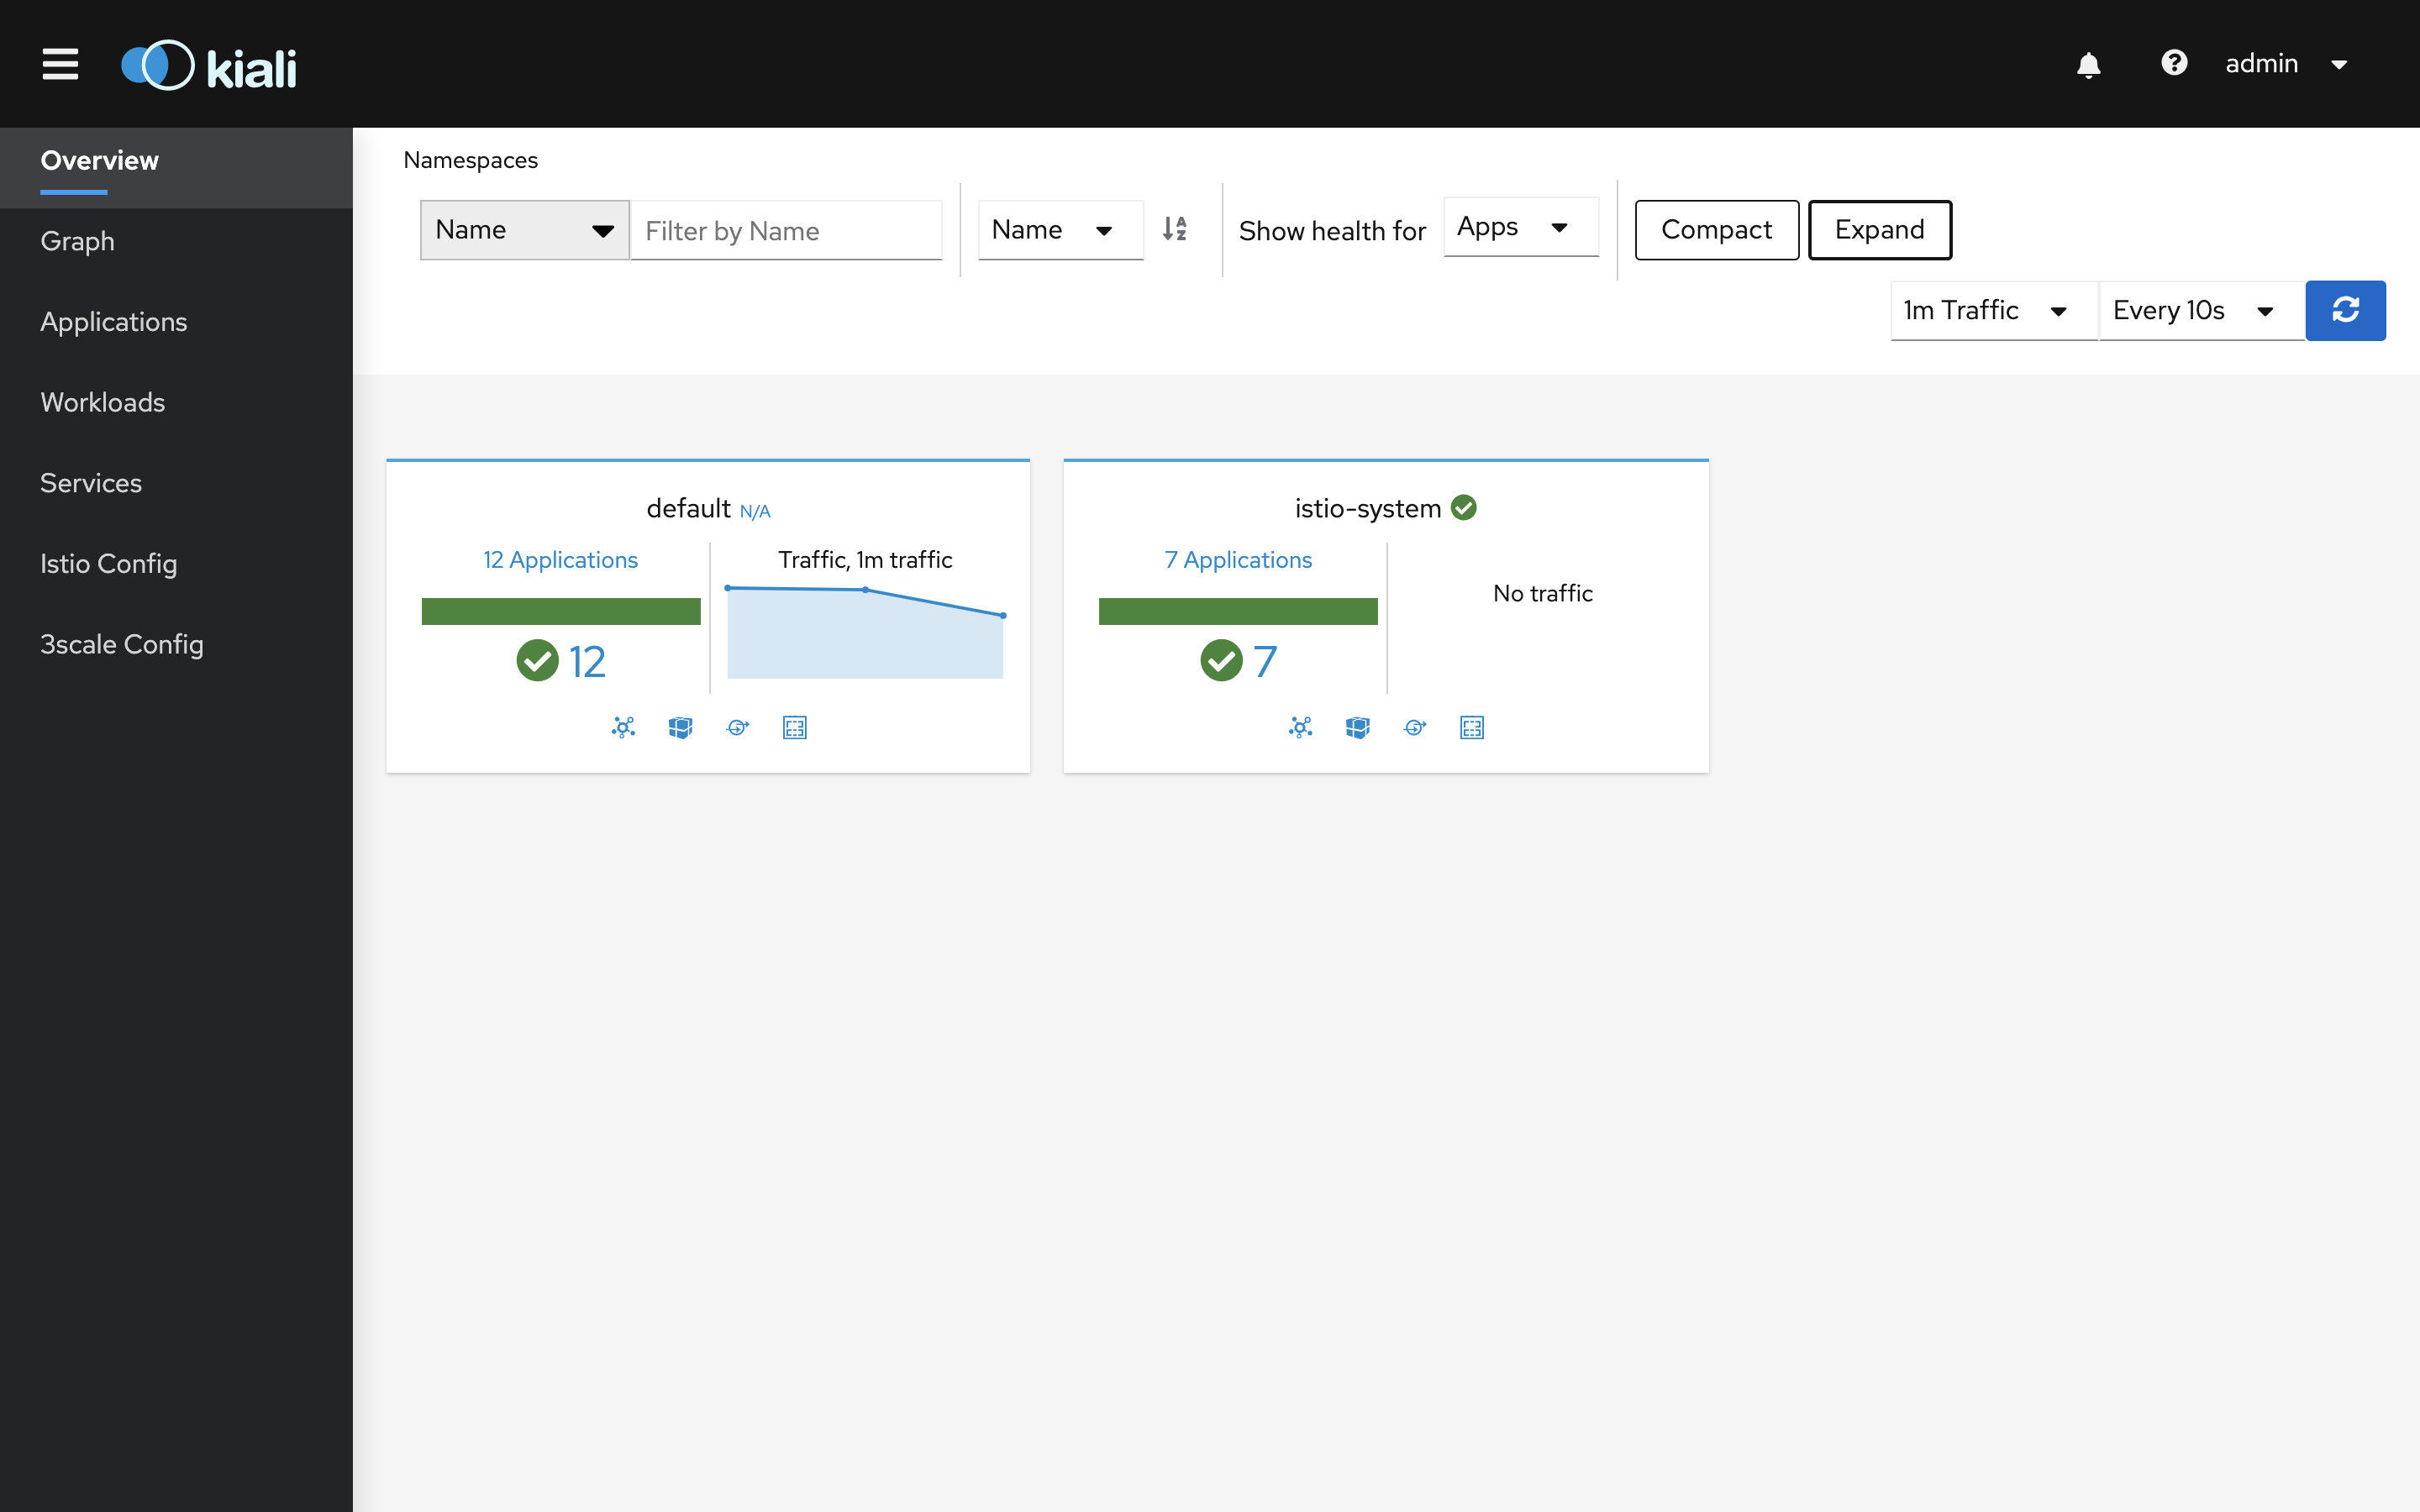
The page summarizes all Kubernetes namespaces that have services registered in the service mesh. In other words: namespaces that contain pods with Istio proxy.
Click on the graph icon in the default namespace card. The graph icon is in the lower left of the
namespace card and looks like a connected group of circles:
![]()
You will be presented with a service graph:
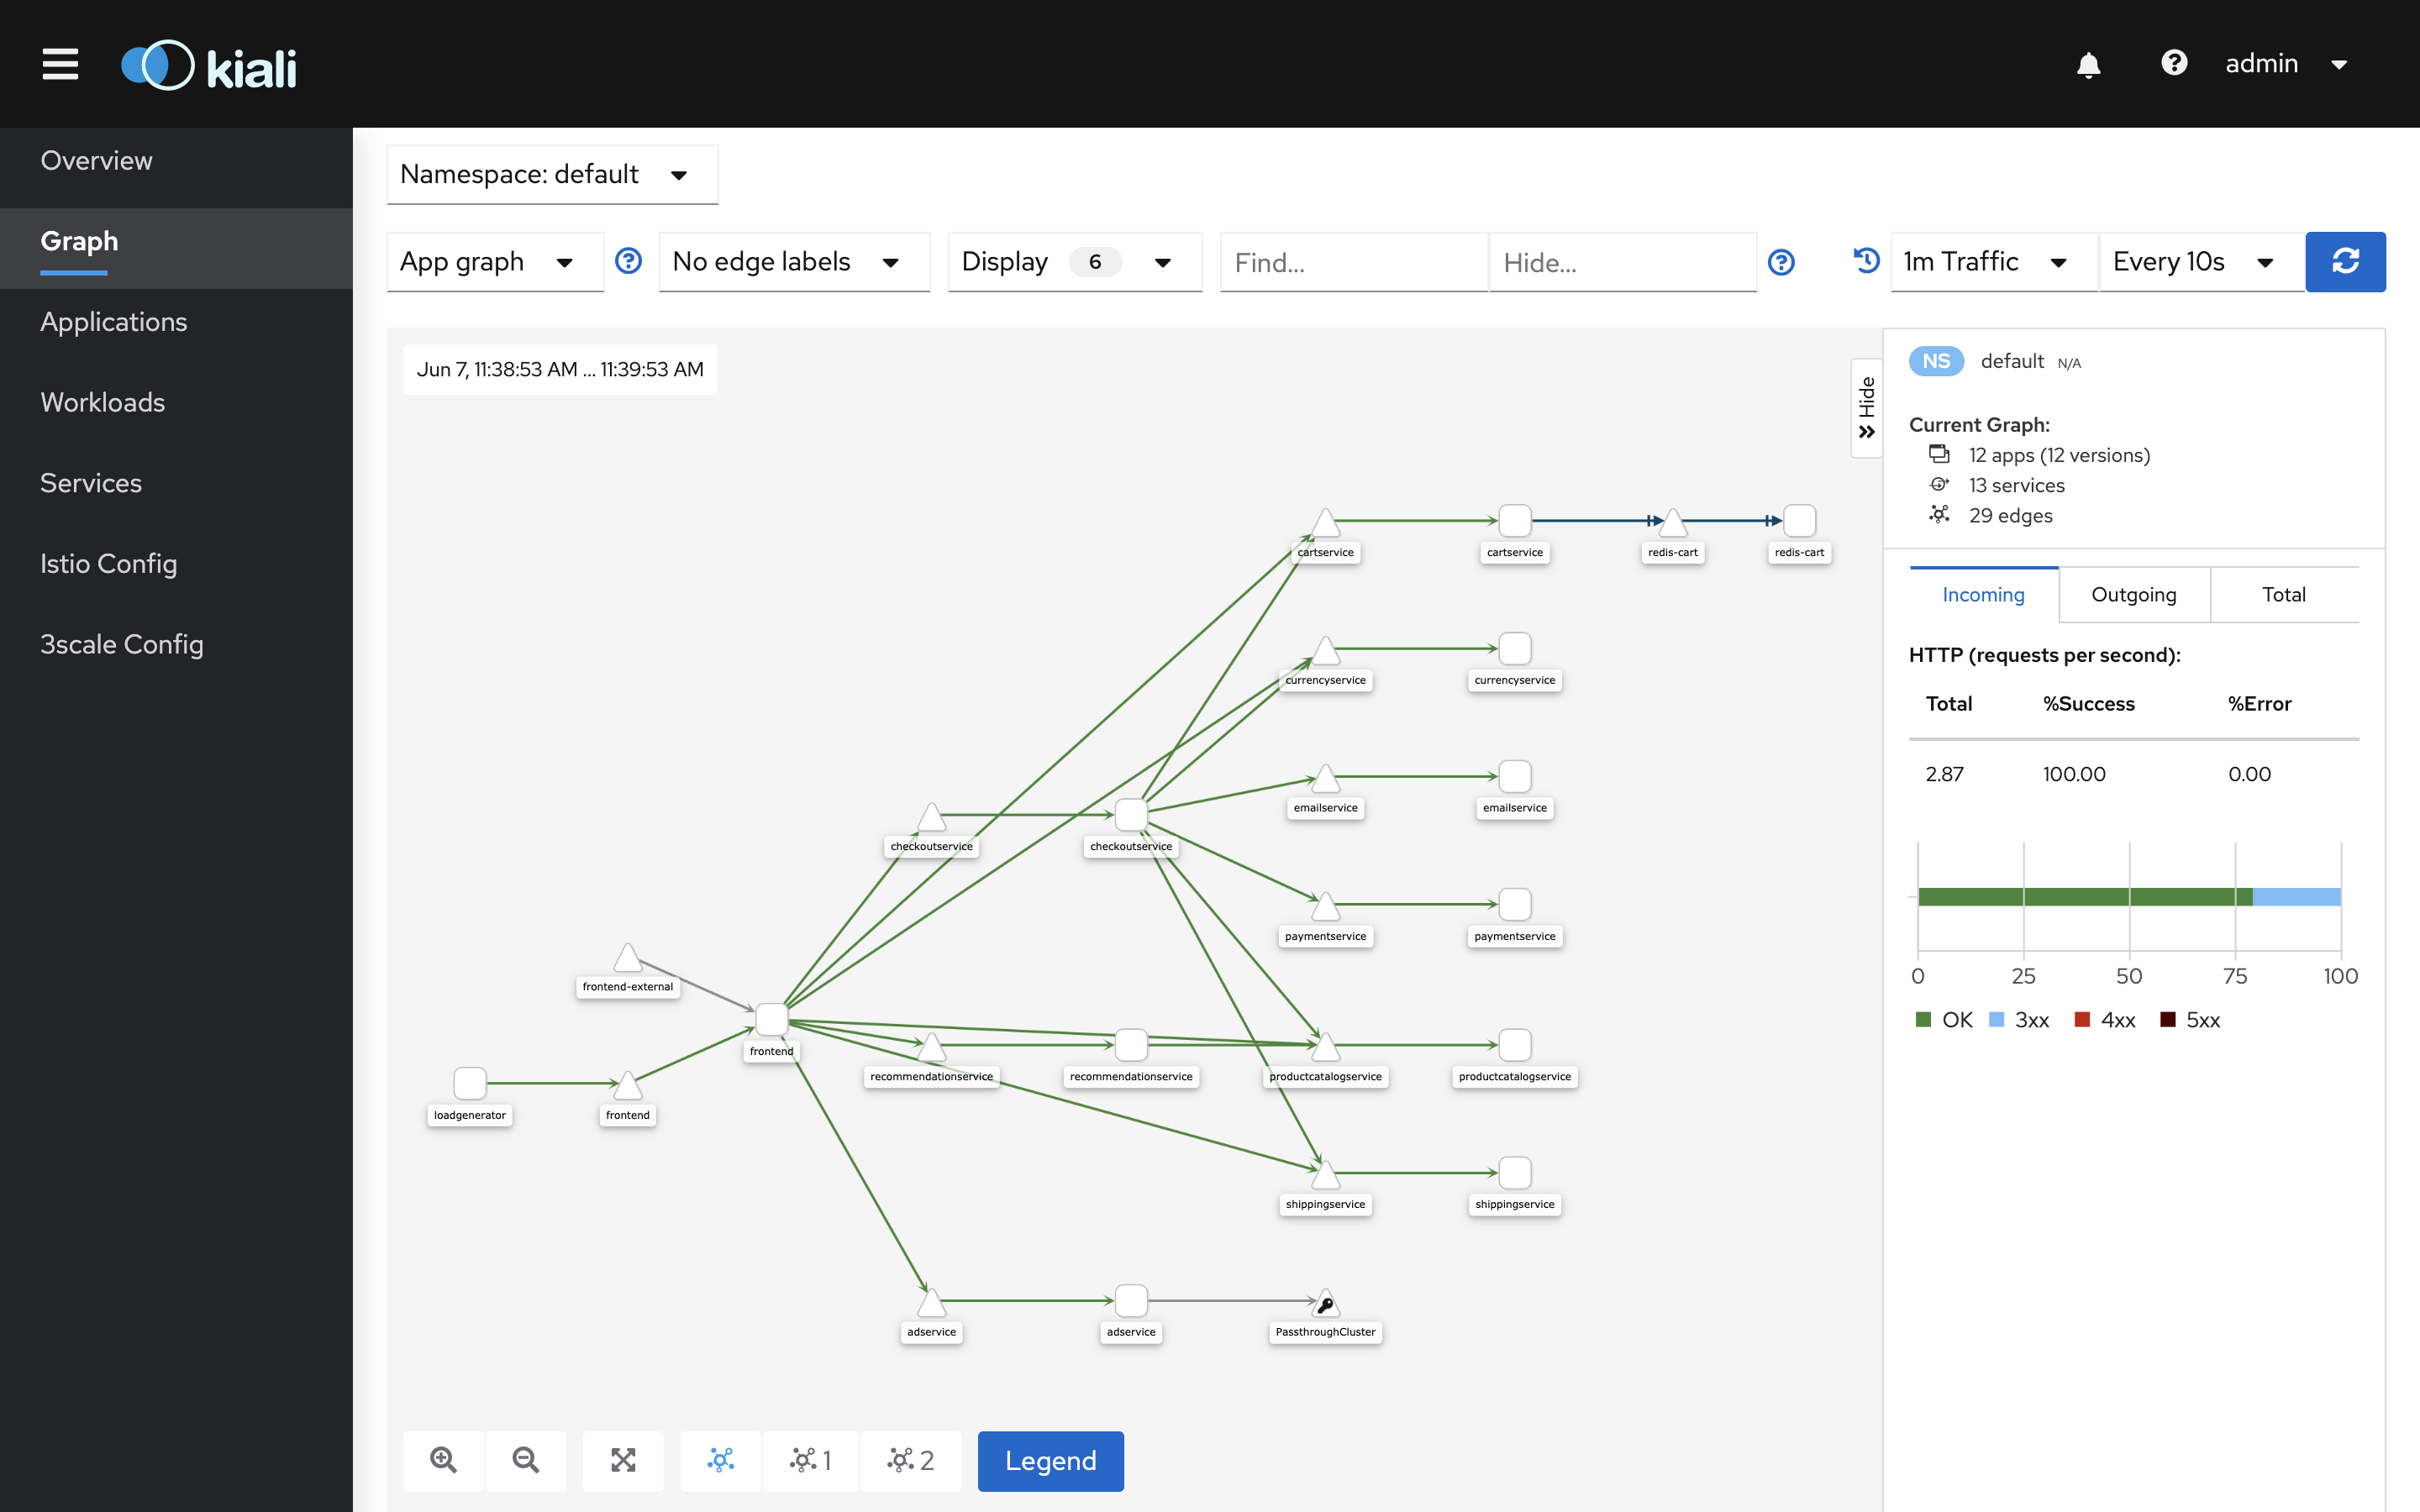
The graph is generated automatically by Kiali from service mesh metrics collected in Prometheus.
The nodes in the graph represent application services, whereas the edges reflect the communication paths between them. Gray edges indicate idle communication. Edges coloured in green indicate healthy communication. Edges coloured in a different color (yellow or red) indicate communication issues - we will evaluate such scenarios later in this workshop.
Now, click on the node representing the checkout service:
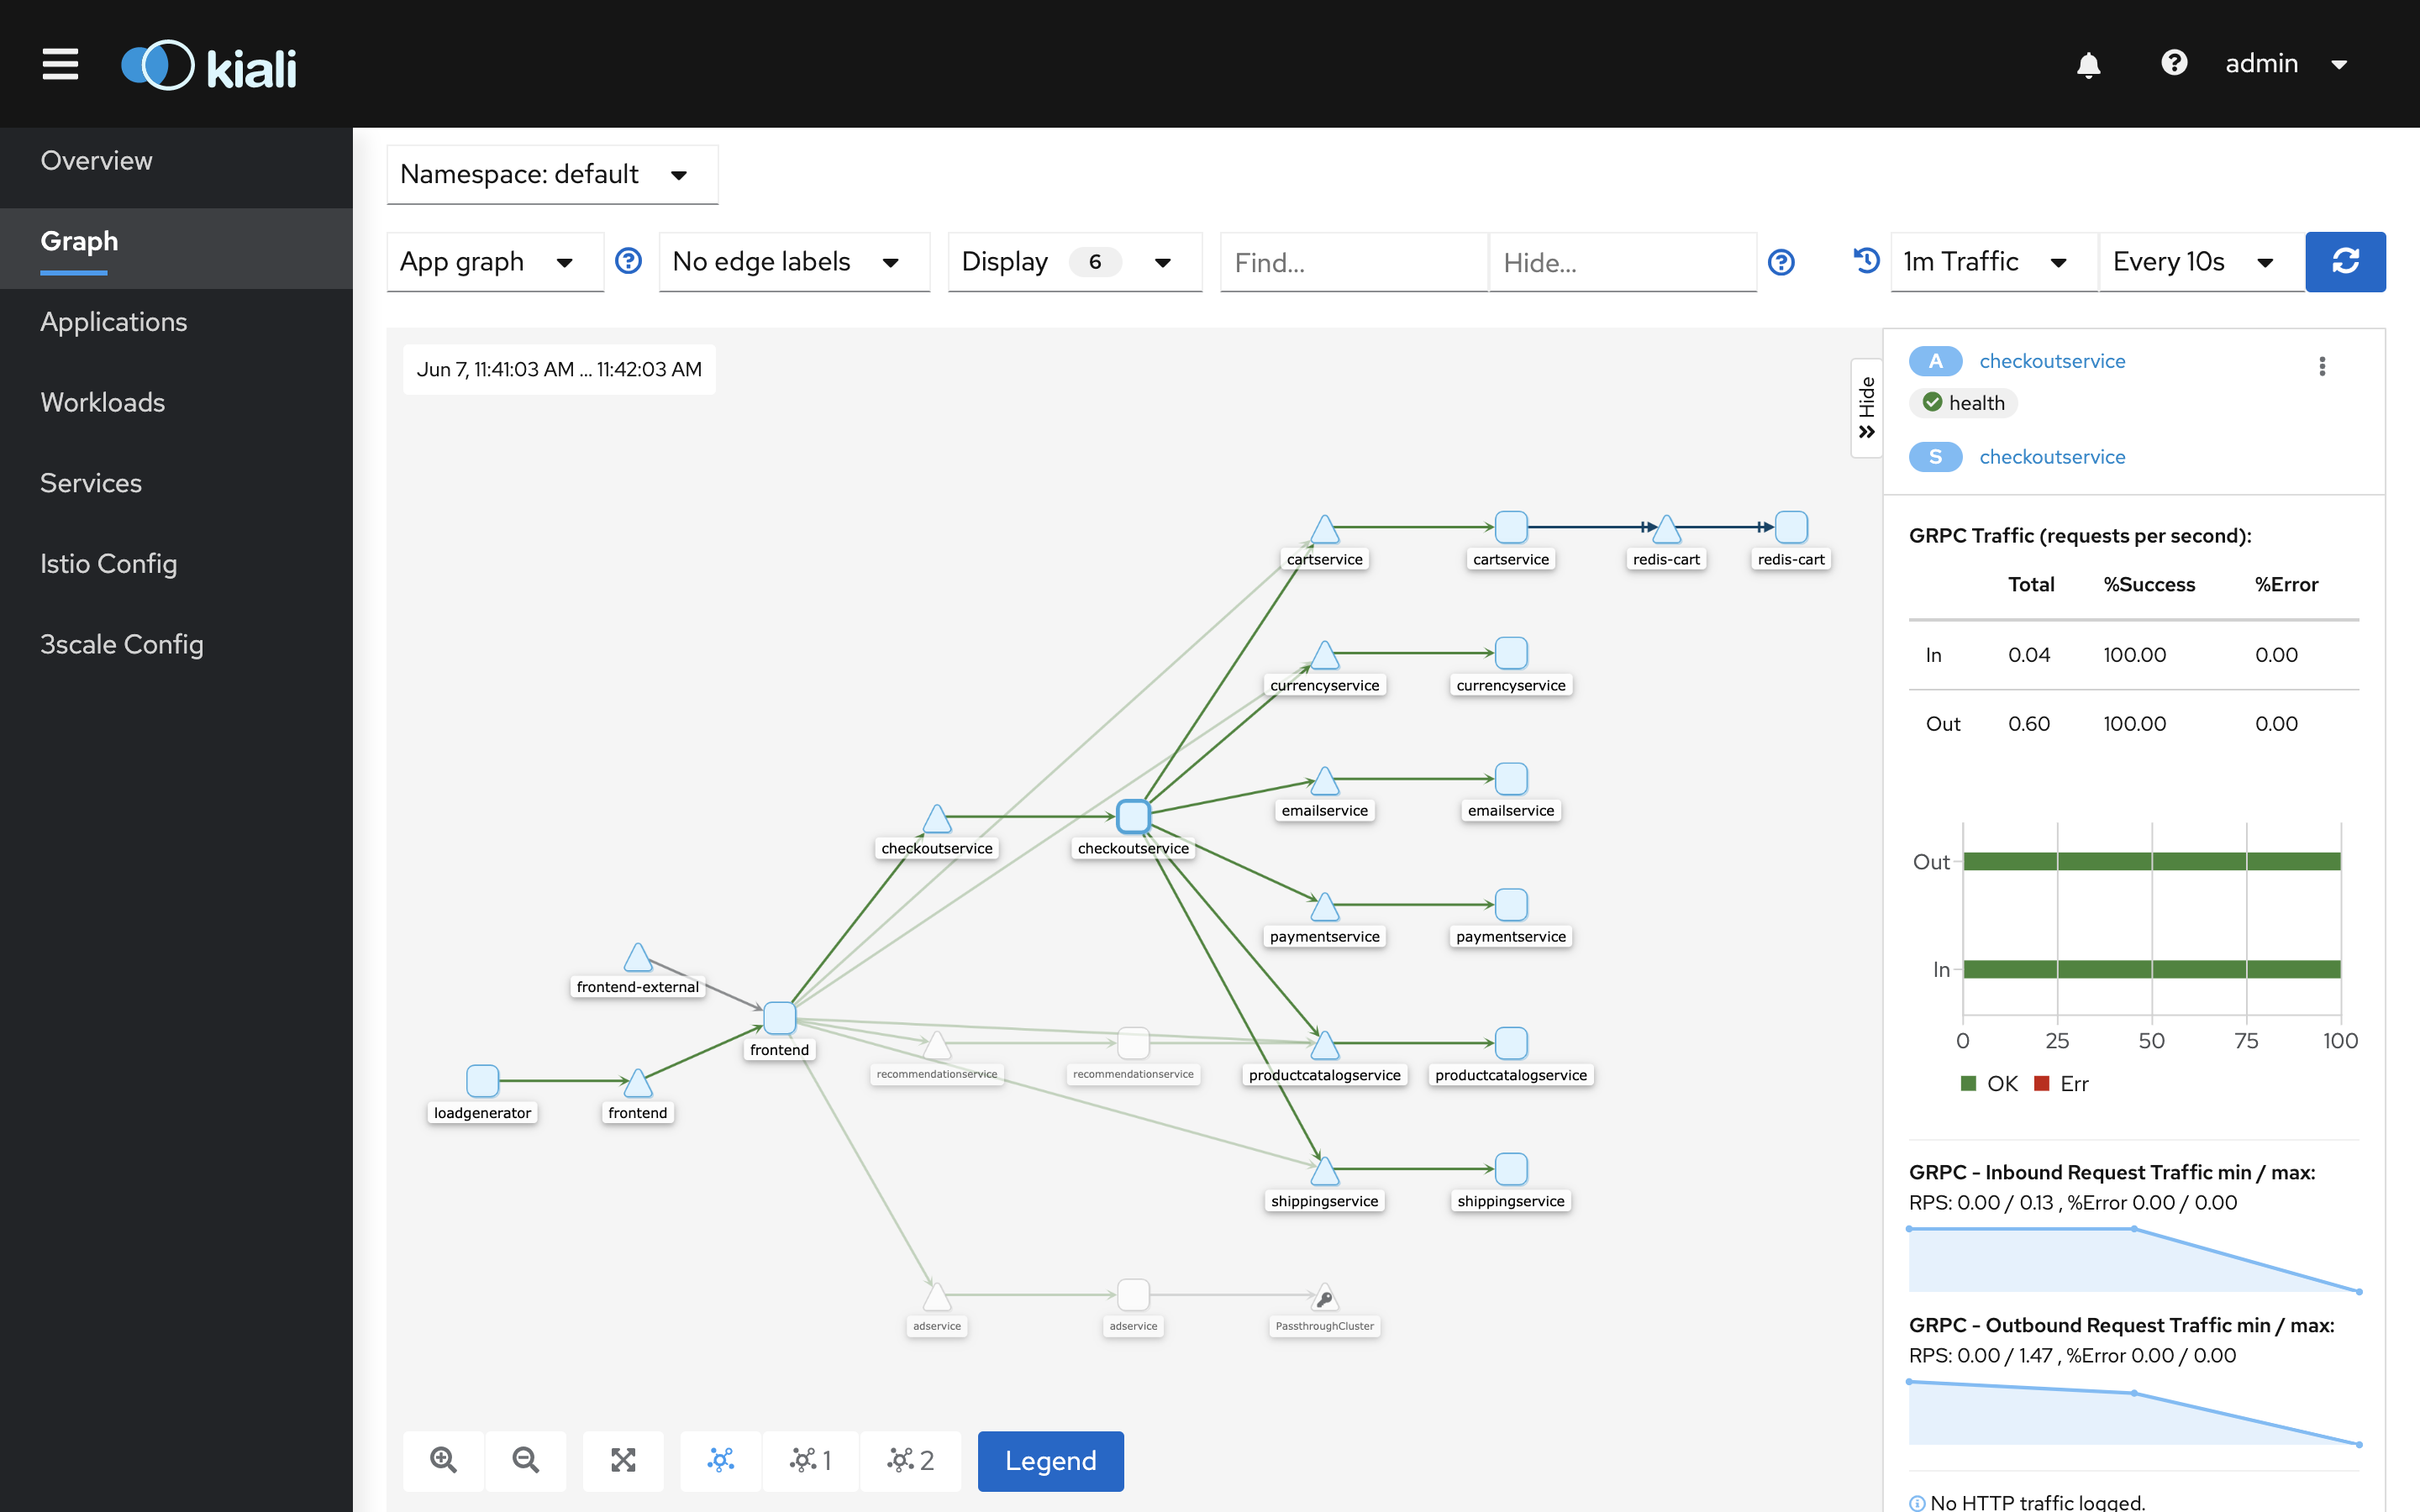
The graph should highlight the ingress and egress edges only for the checkout service. This way
we can quickly lookup which services communicate with the selected service, and also which services
the selected service communicates with.
In addition, the dashboards presents basic communication metrics in the box on the right:
- operations per second (for ingress and egress traffic),
- success and error rates.
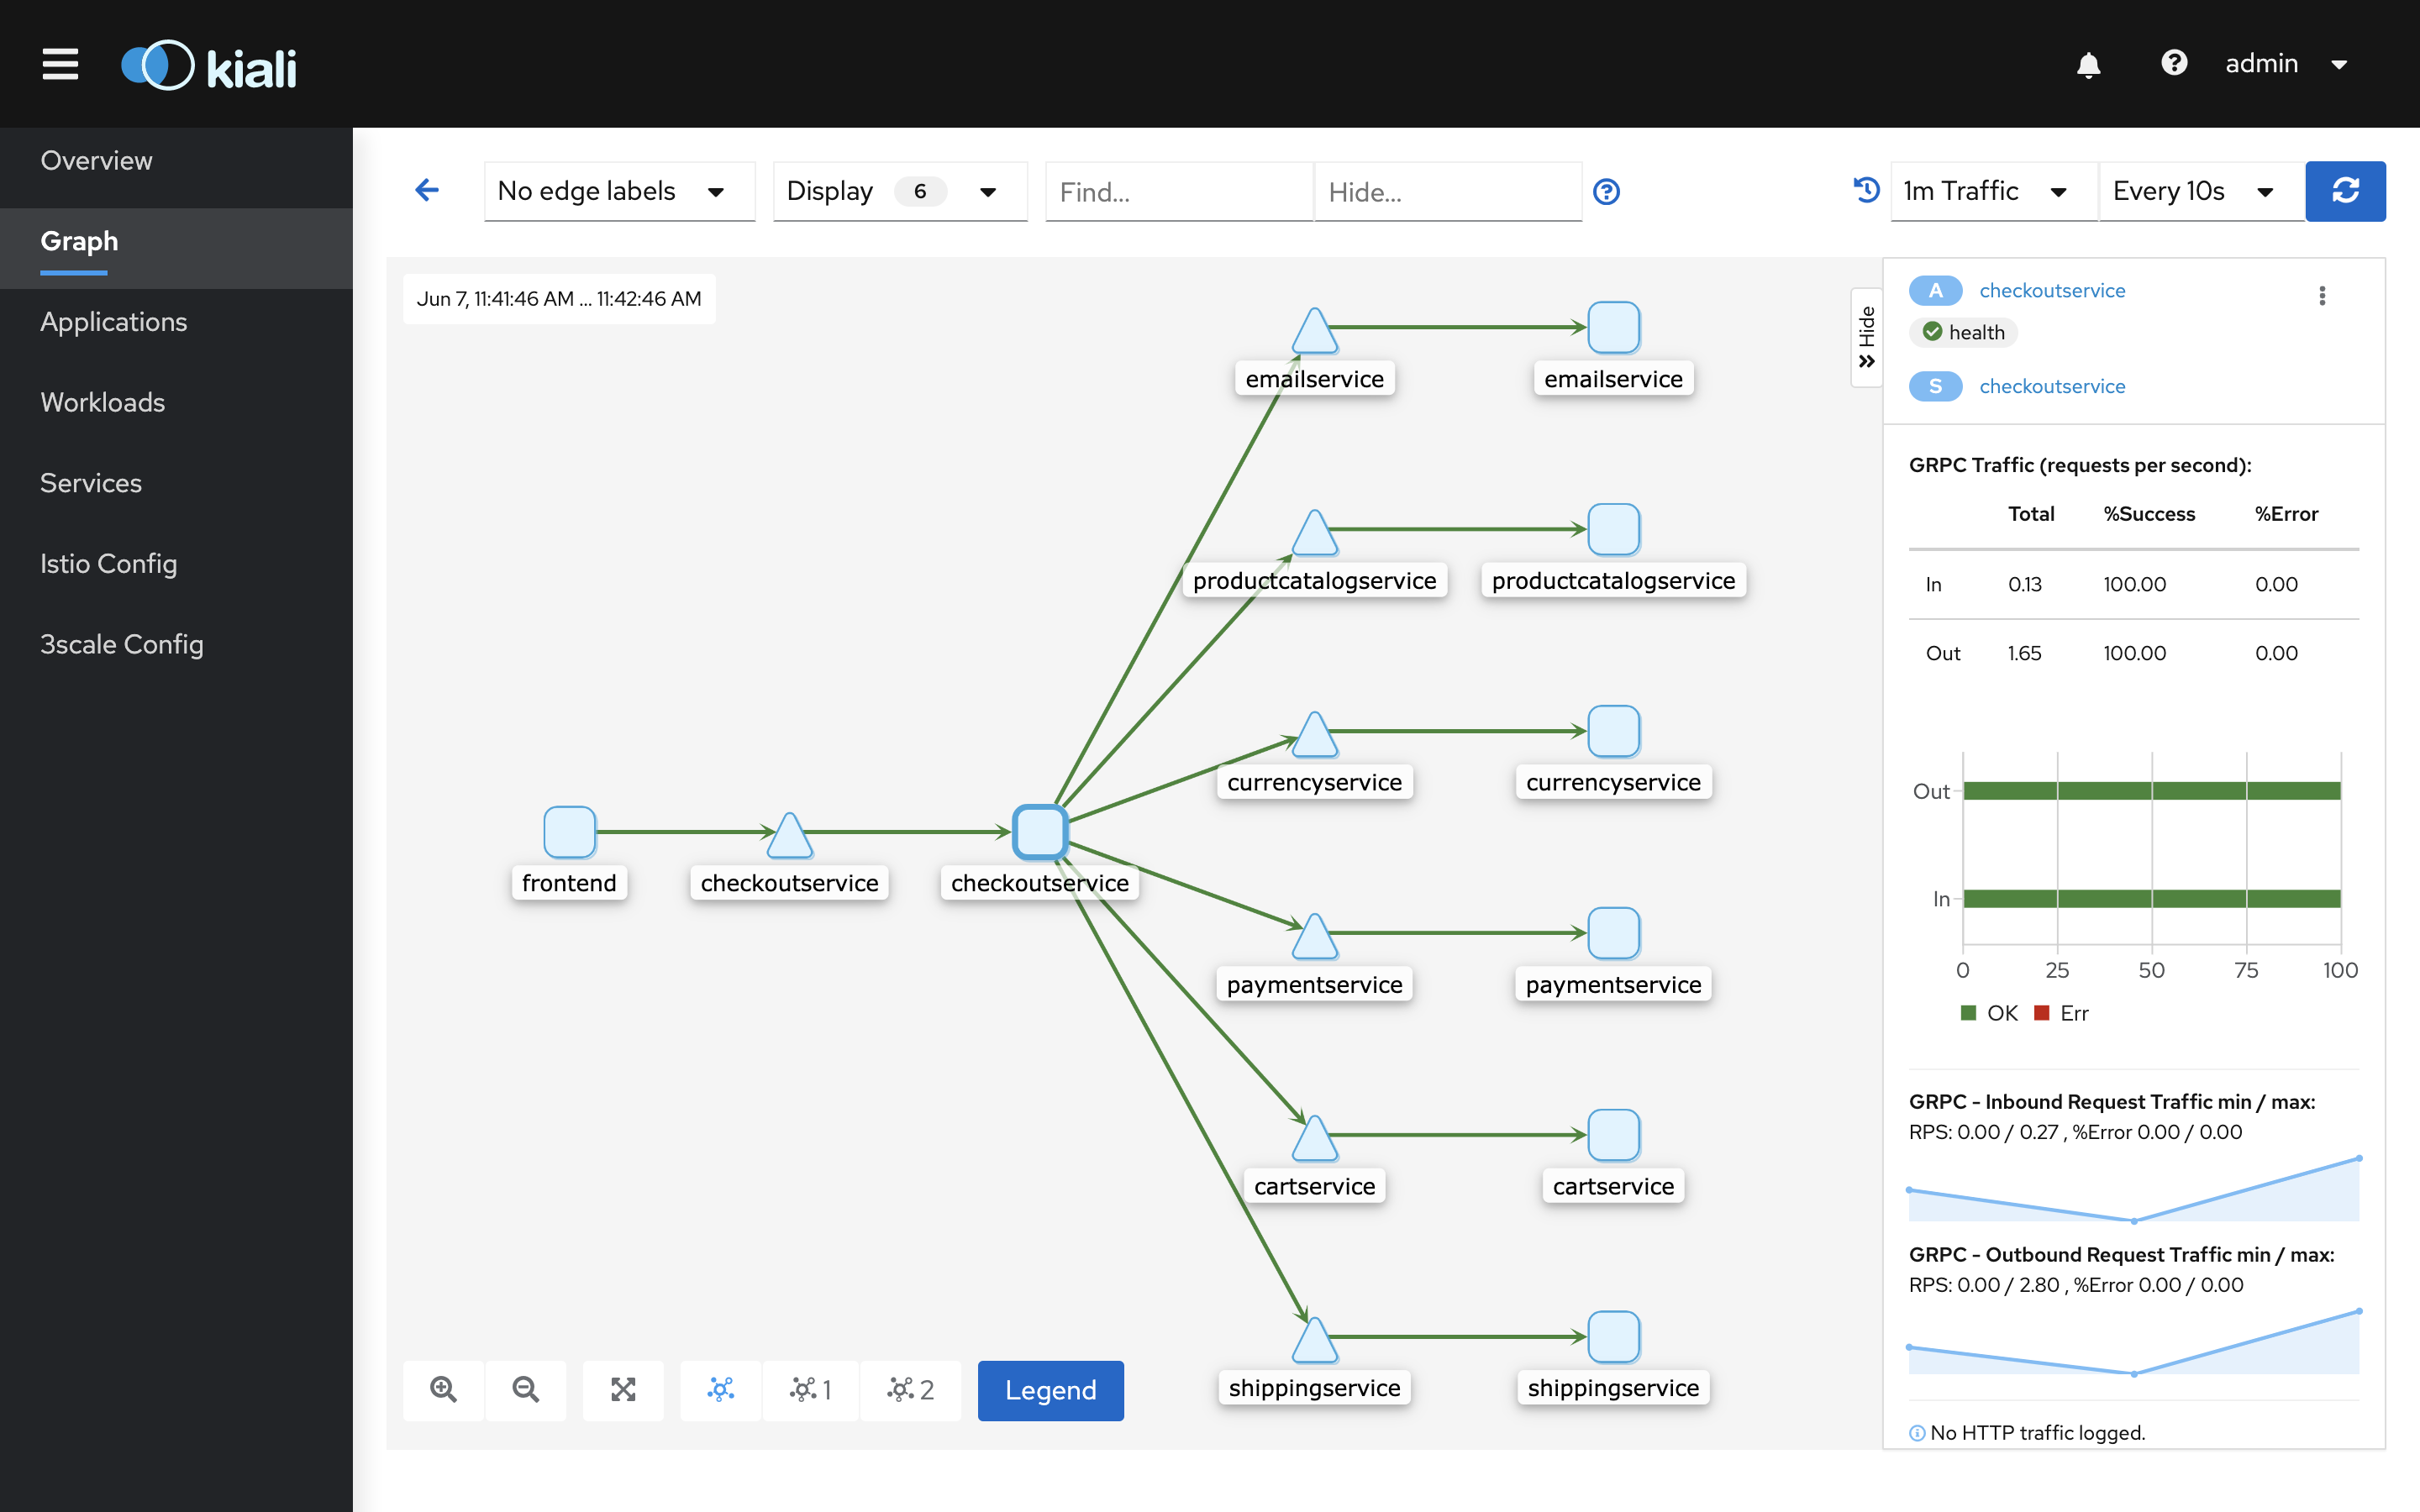
Double-click on the checkout node to retreive the service subgraph with limited view of
application services:
Now, click on the edge between the checkout and the email service:
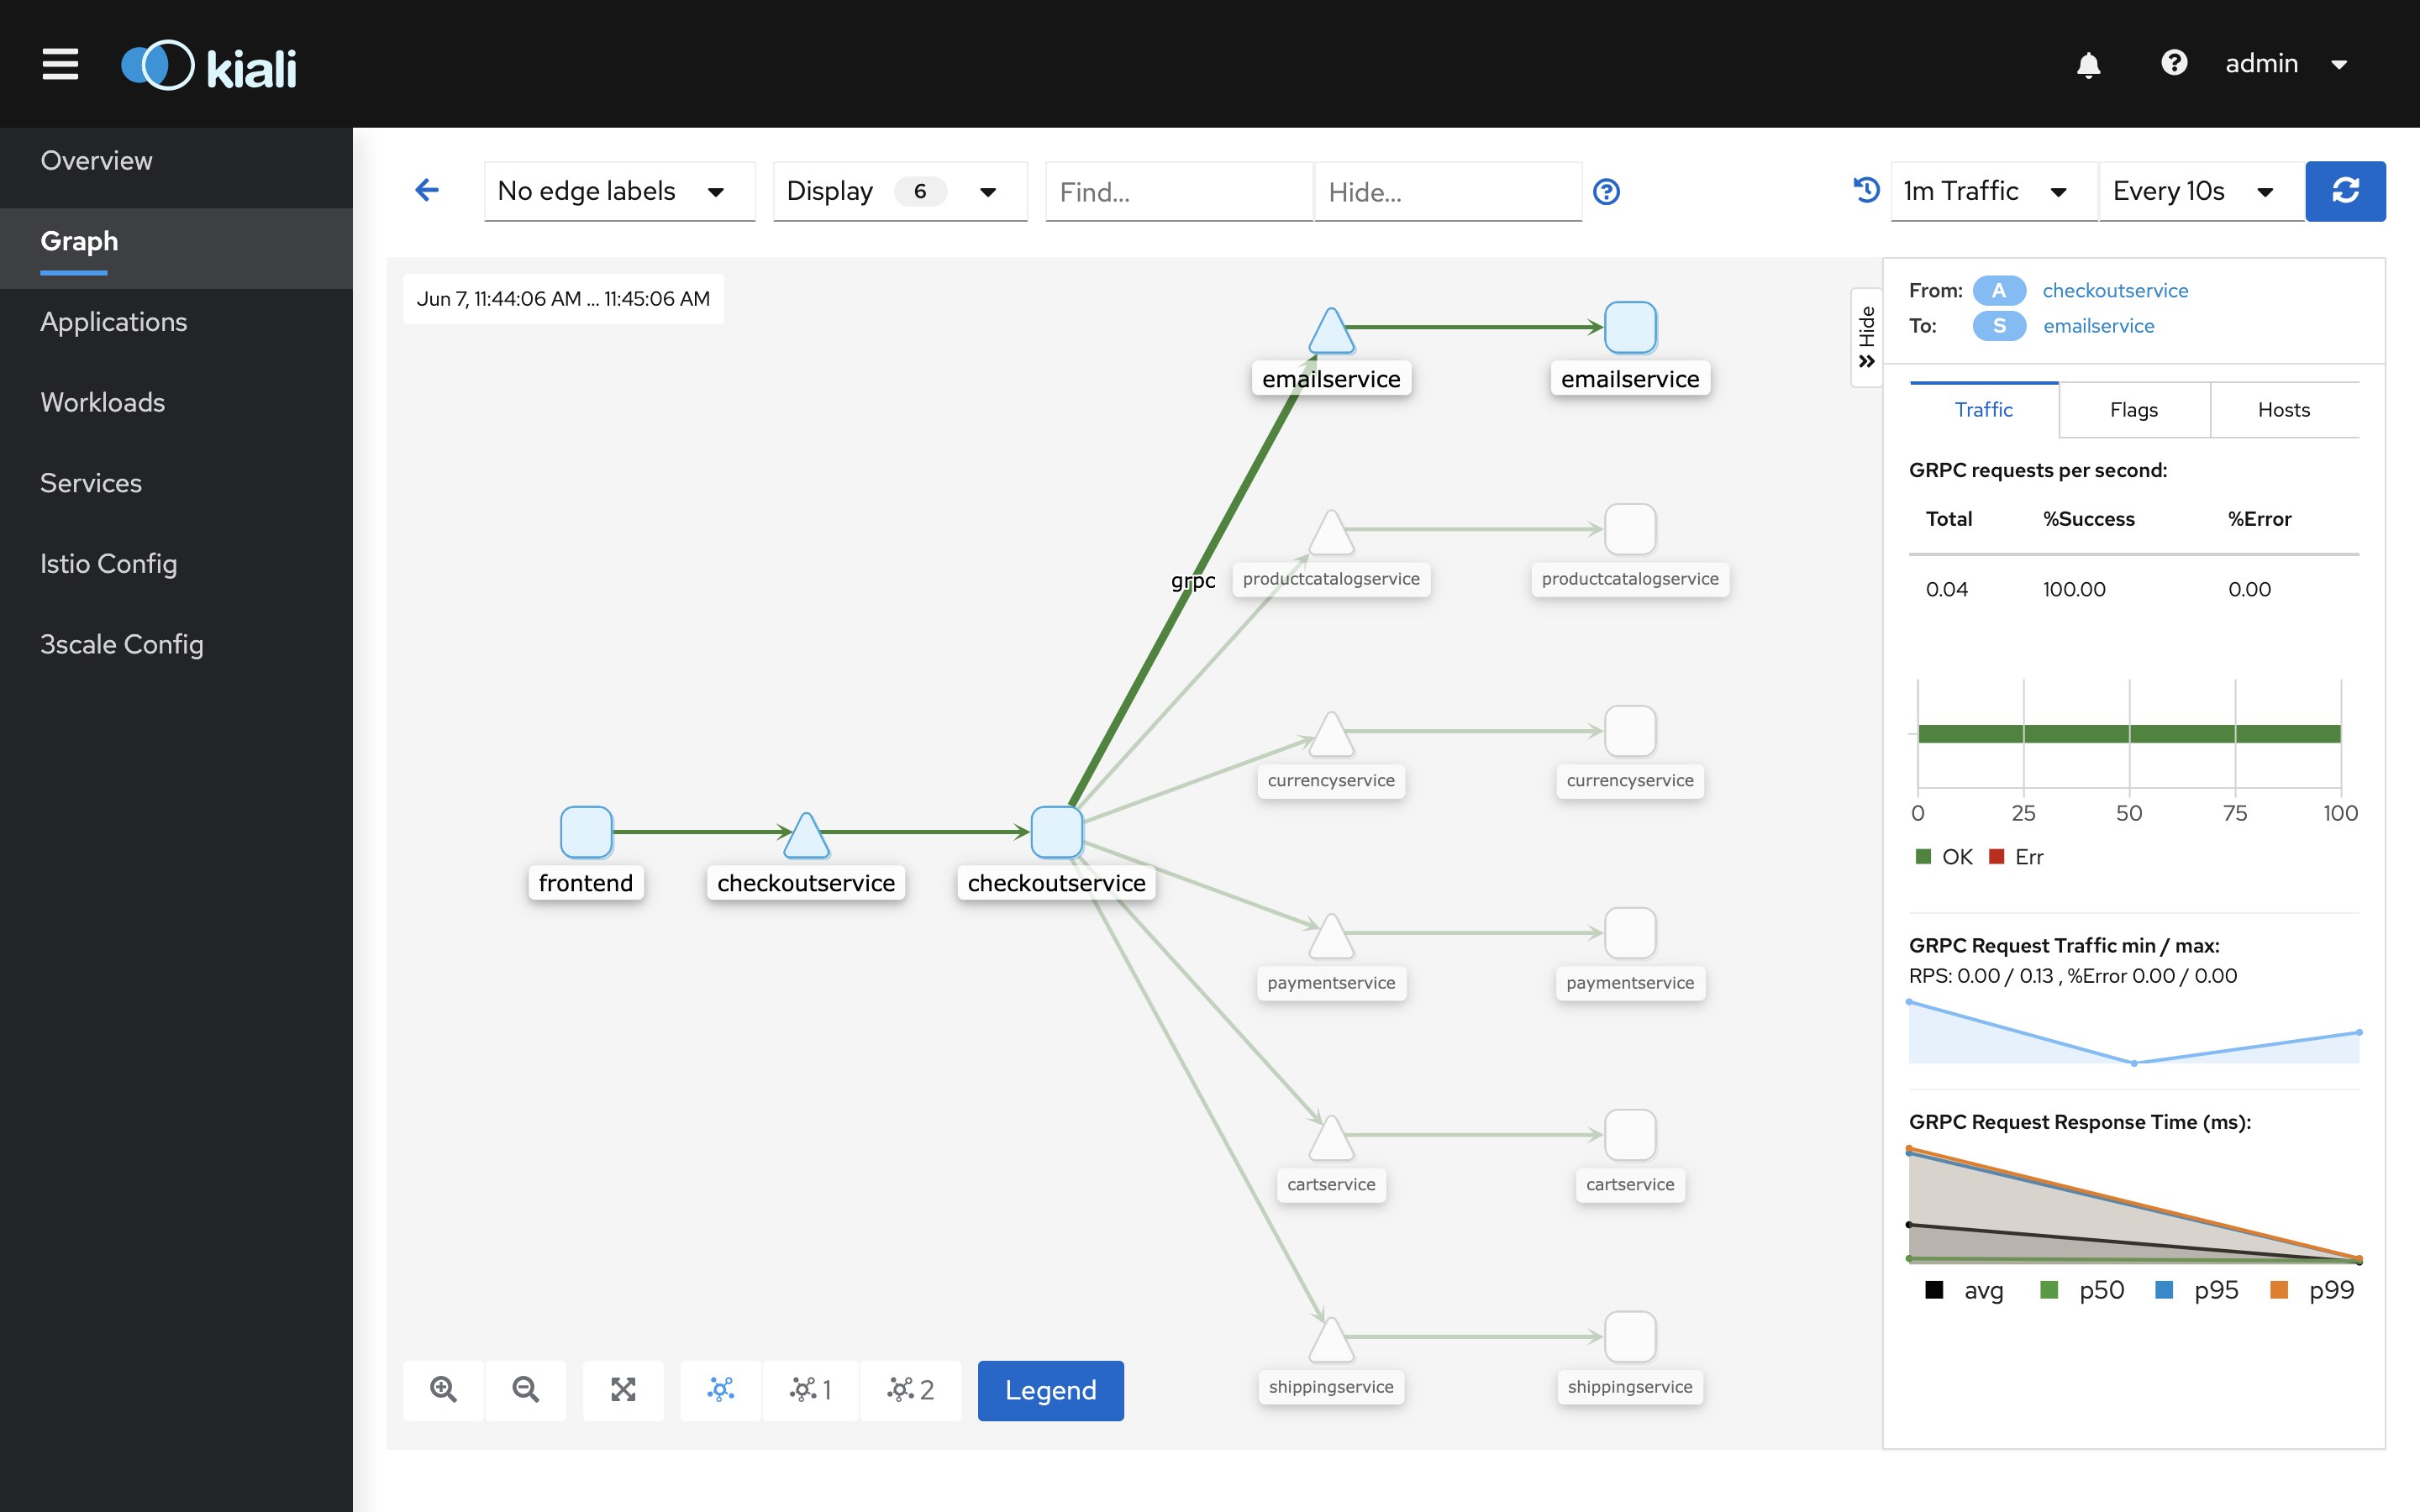
The edge should be highlighted and the dashboard should present the basic metrics for the communication path between these two services:
- used protocol (gRPC in this case),
- operations per second,
- success and error rates.
Go back to the full graph:

Switch to the Service graph view using the dropdown:
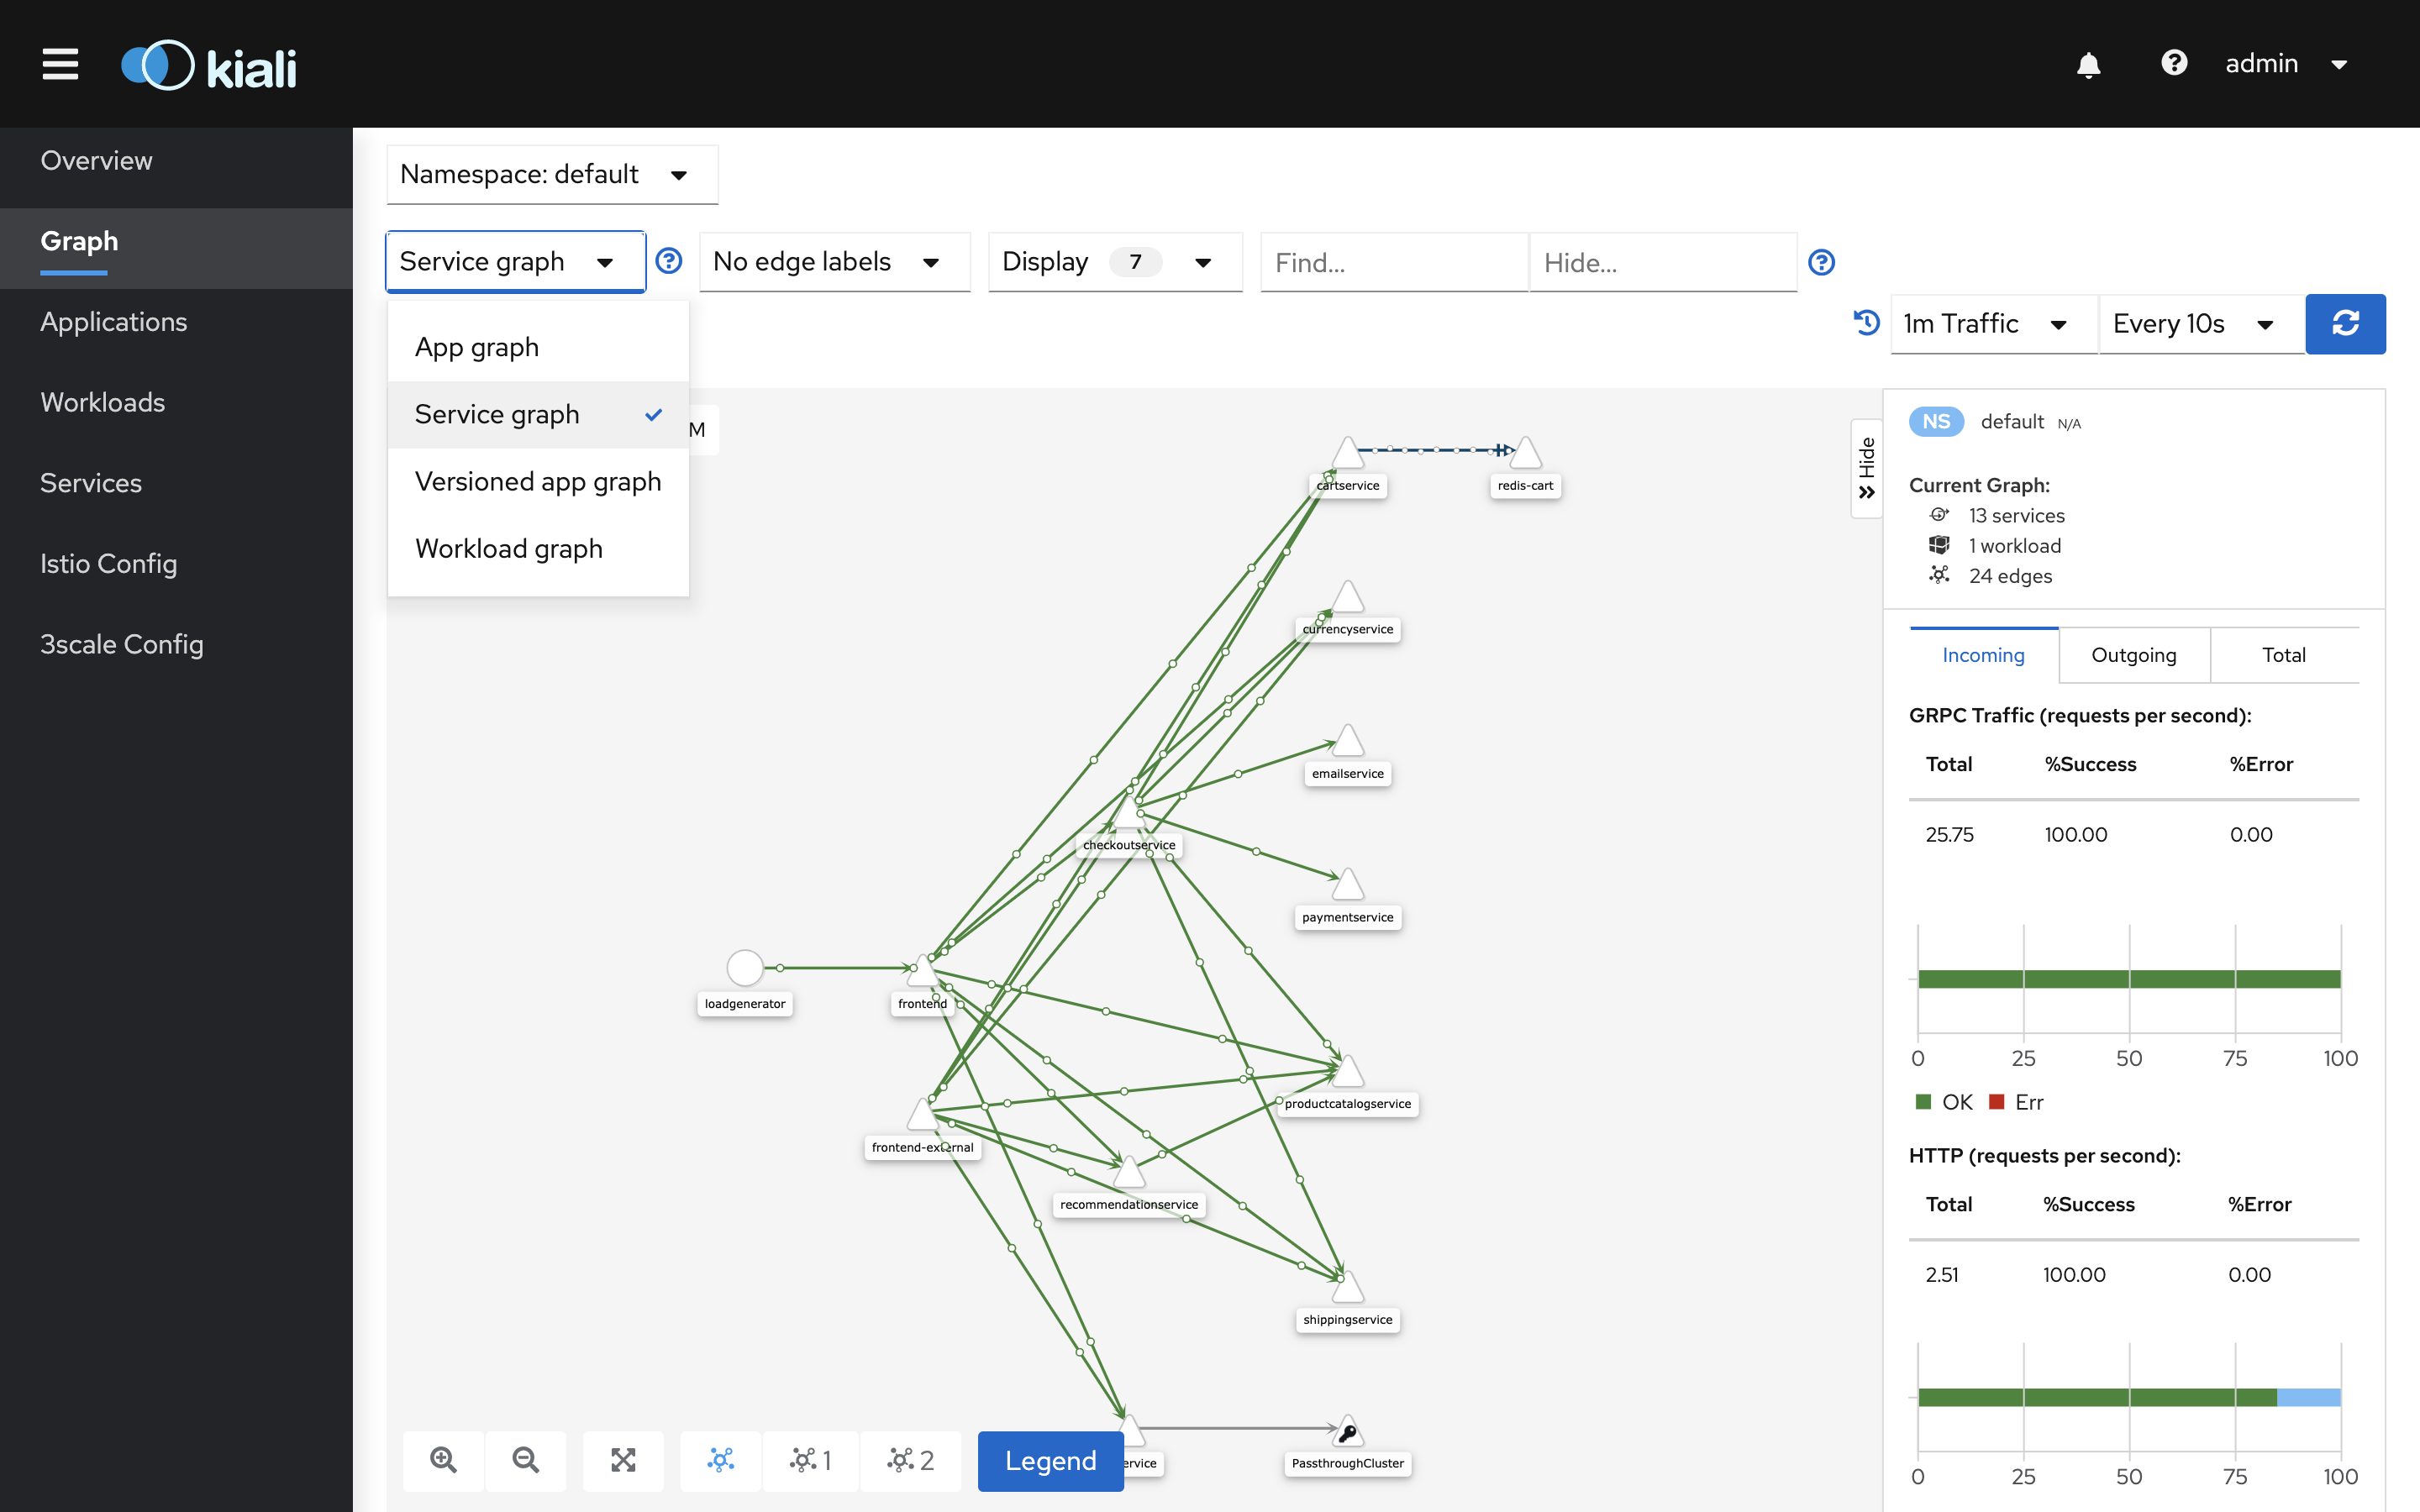
This view presents only services participating in the commmunication. There is no application context. The graph might serve as a simple lookup for identifying inter-service dependencies.
Switch to the Versioned app graph view:
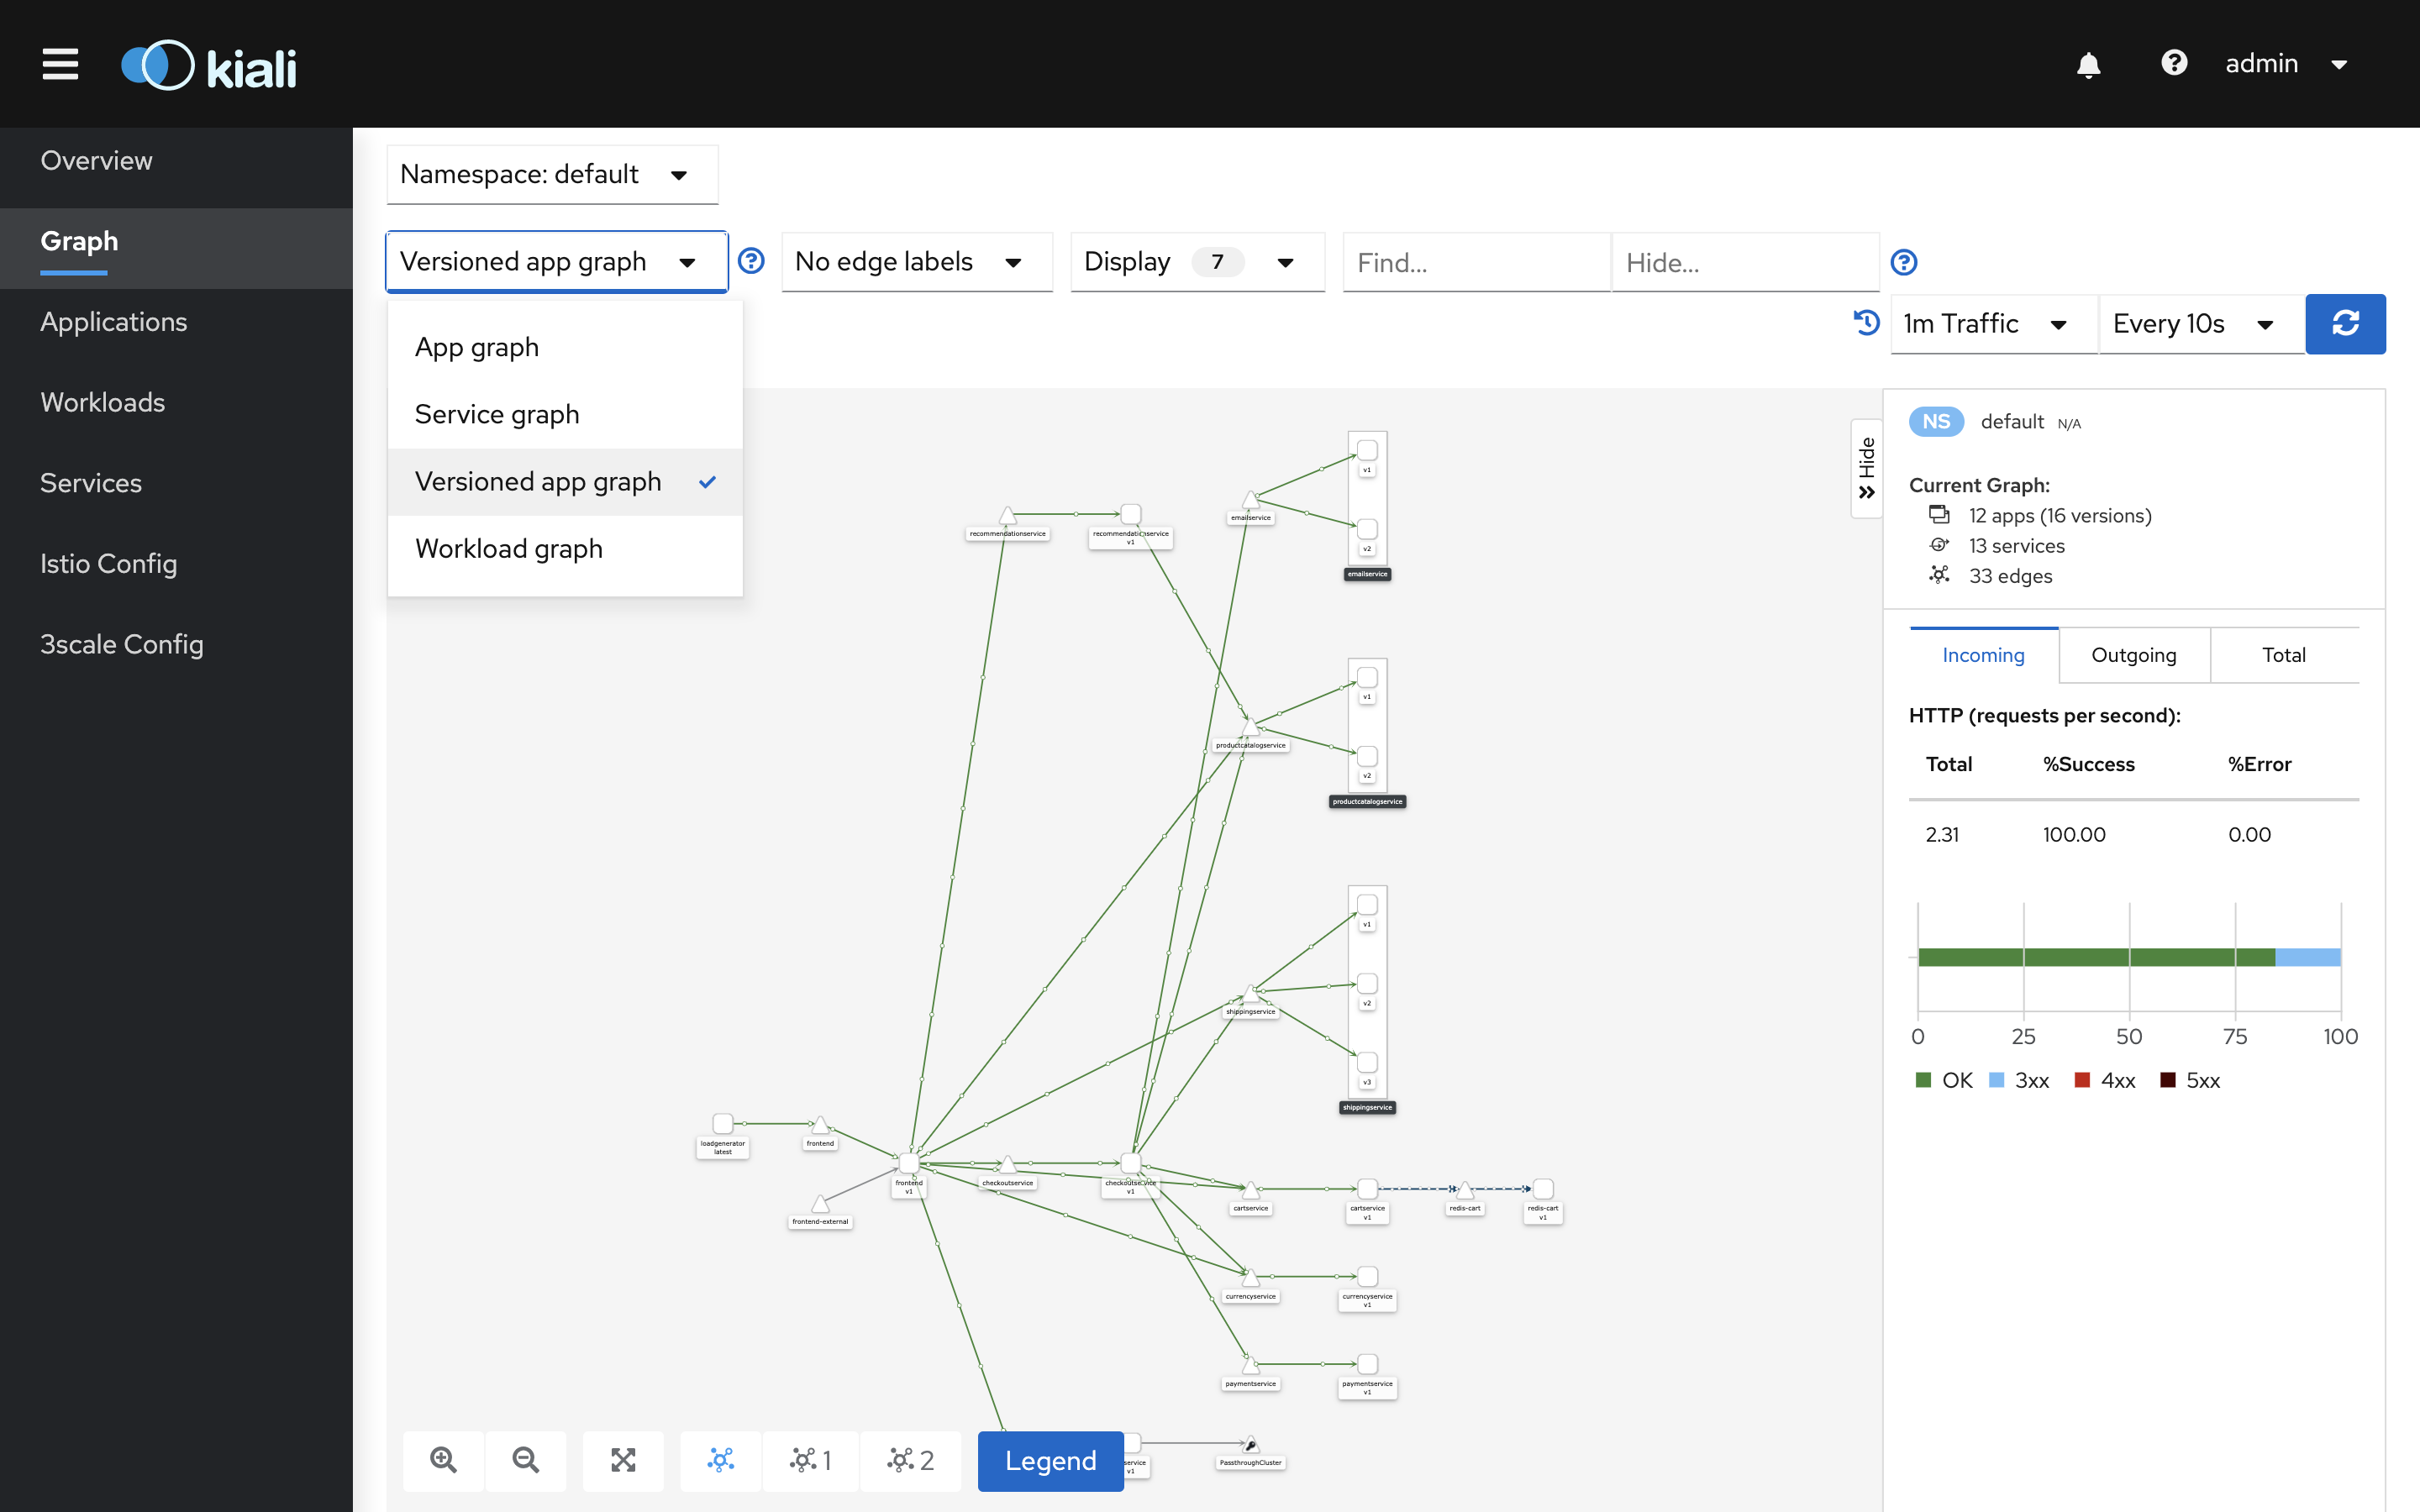
This view presents inter-service communication along with traffic distribution between service versions. The graph is useful during the deployment of new service versions, e.g. canary releases.
Lastly, turn on Traffic Animation in the Display settings to get the real-time graph experience:
Small dots represent the traffic intensity. For intensive traffic, the dots are displayed denser and faster.
Exercises
- Is the inter-service communication healthy? How do you check that?
- What is the entry-point service of the application?
- Which services communicate with the
currencyservice? - Which services communicate with the
productcatelogservice? - Which services does the
checkoutservice commmunicates with? - What is the request volume (ops) for
currencyservice? What are its success and error rates? - What is the request volume (ops) for
paymentservice? What are its success and error rates? - What protocol is used on the communication path between the
frontendand therecommendationservice? - What protocol is used on the communication path between the
cartservice and theredisservice?